Home Blog

8 Facts about Today’s 30-Year-Olds versus Those in 1975

0
30 Year Olds Today vs 1975 - US Census Data

More Educated, Fewer Homeowners, Fewer Married with Children


Do long-term demographic trends pose a challenge to the residential real estate market? Today’s 30-year-olds are more educated and more likely to be working than those from 1975. But, they are also less likely to have a moderate income, a home of their own or be married. What does it all mean to the future of housing?

The U.S. Census Bureau’s collection of detailed demographics and socioeconomic statistics on Americans provides us with useful insights on an important group of first-time home buyers: those in their late 20s or early 30s. This “Measuring America” infographic highlights eight significant trends among this group as it compares to their peers from 40 years ago.

Then and Now - 30 Year Old - US Census


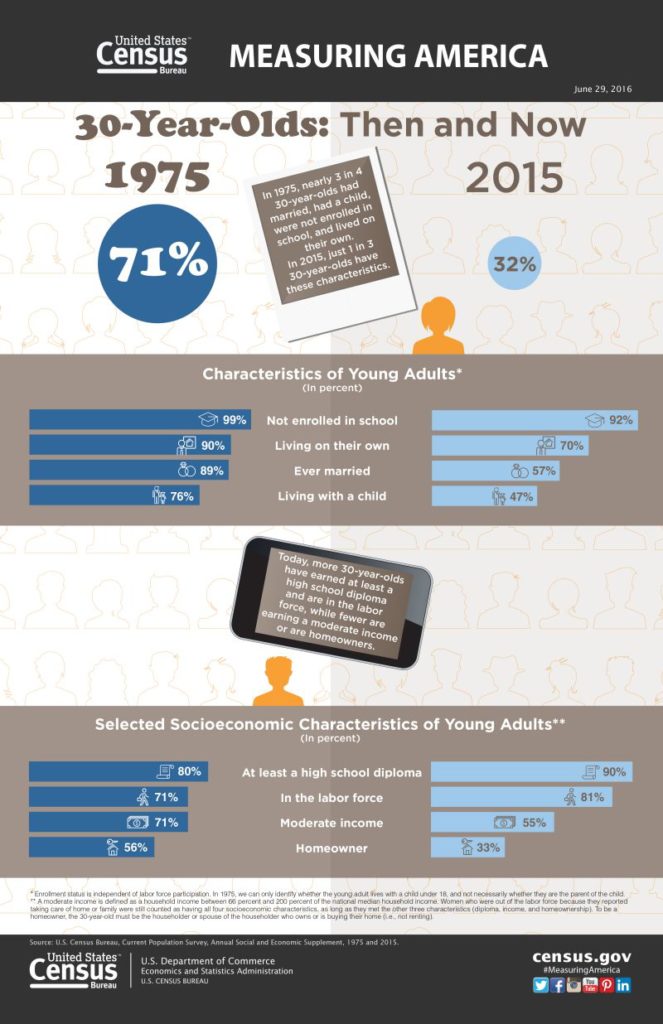
In 1975, nearly almost three out of every four 30-year olds had married, had at least one child, and lived on their own.

Fast forward to 2015.

Most astounding — unless you happen to have a 30-year-old son or daughter — is that only one in three 30-year-olds have the same characteristics today.

As the “typical” new family formation occurs later in life, expect to also see a shift in the expectations these families will have as to their housing. It certainly means longer periods of living at home with parents as well as more rental housing. As these families are starting later, it also likely means fewer “starter homes” and less home turnover. Expect to see more families looking to purchase a “forever” or “here to stay” home rather than trading up.

Another important shift is related to income. In 1975, 71% of 30-year-olds earned income at a moderate level. As a result, these young adults had the financial stability to own a home and qualify for a mortgage. Today, only 55% of 30-year-olds earn income at a moderate level, making it more challenging for them to qualify for a mortgage and buy that first house.

Should the single-family, residential real estate market be alarmed by these trends?

On some levels, the direction of a number of these trends has been exhibited since post World War II: college-educated men and women tend to get married later and thus have children later in life; the country has seen a tremendous increase in the number of college-educated adults over the last 70 years. Other trends have perhaps been magnified by the Great Recession, which delayed or disrupted the careers and earnings of many of these young adults. Still, others may be a reflection of changing social norms and the greater acceptance and practice of new family structures.

Ultimately, however, homeownership still remains a desired goal even among Millenials. According to a national survey conducted by Fannie Mae “millennial renters today have as much desire to own a home as the general population of renters.” Among 18-34-year-old renters, 91 percent would like to own a home at some point.

As younger workers realize wage gains and enjoy improved personal finances — and if interest rates continue to remain low — we should begin to see a moderate transition by this group to homeownership.


Sources: U.S. Census Bureau, Current Population Survey, Annual Social and Economic Supplement, 1975 and 2015; Fannie Mae, National Housing Survey

The Single-Family Home Continues to Grow

0

According to the US Census Bureau’s latest report, single-family homes continue to grow in size. The median single-family house built in 2014 had 2,453 square feet — an increase of almost 3% over the prior year.

Other highlights from the Housing Characteristics Report:

— The trend is towards four-bedroom homes. In 2014, 46% of homes had four or more bedrooms. Ten years ago, only 37% had four or more bedrooms while 51% had three bedrooms.

— When it comes to outdoor living, porches and patios rule. Over 80% of all homes built had either one or both outdoor features.

— Wood framing dominates construction throughout the U.S. — although concrete represented 13% of homes constructed in the South in 2014.

— Just built your new home in a homeowners’ association (HOA)? Chances are you did! 59% of all single-family homes built in 2014 were constructed in an HOA. Homeowners’ associations have grown increasingly popular in the South and West with 67% and 65%, respectively, of all new single-family homes there being built within HOAs.

— Nationally, the median contract price per square foot for new single-family homes edged up approximately 3.5% to $96.72 per square foot. However, regional growth in construction costs varied greatly. In the West, costs per square foot increased a whopping 15.2% while costs in the Midwest were relatively contained with a growth rate of approximately 2.6%.

The data is collected from the US Census Bureau’s annual Survey of Construction (SOC) in conjunction with the US Department of Housing and Urban Development (HUD). For more information and data from the latest US Census Bureau report, please click here. The US Census Bureau also created a entertaining infographic for those looking for something a bit more visual.

Home Ownership Rate Falls to Lowest Level Since 1995

0

The U.S. Census Bureau announced in a report released today that the percentage of Americans who own their own homes was 66.4% in the third quarter of 2014 – down from 64.7 percent in the previous quarter.

After peaking at 69.2 percent in June 2004, the rate has repeatedly fallen since then due to the financial crisis and home foreclosures. More recently, while the economy has slowly recovered, entry-level buyers have struggled to purchase or build homes due to slow wage growth and the toughened mortgage standards still in place since the initial crisis.

Economists continue to be mixed as to the outlook from here. With demand for rentals soaring, this is a trend that could continue as Americans look away from home ownership and towards the flexibility offered by rentals. Others see a more optimistic forecast for home ownership rates over the long run, as low interest rates coupled by lower unemployment rates raise buyers’ confidence to return back to owning a home.

According to the National Association of Realtors, the share of first-time buyers was 29 percent in September (and the same rate in the previous three quarters), compared to approximately 40 percent historically – this may suggest room for further growth.

Top 10 Questions to Ask Every Contractor Before Hiring

0
Contractor - Builder on Phone

Are you about to start a new home building or remodeling project? If so, you will likely be hiring at least one contractor during the process. There are many excellent contractors to choose from; unfortunately, there are also some out there who are not qualified. Would you allow just anyone to work in your home? Is the lowest price always the best choice? Are you protected? Are they insured? Do you need a permit? Do they have the experience? Is there a guarantee or warranty? There are many questions to ask.

To protect yourself and ensure an enjoyable house construction experience, here are 10 questions to ask when hiring a general contractor.

1. Do you have references?
Seek references from colleagues who have had similar, house plans, renovations, or building projects. Business associations, building and renovator organizations, and the Internet are other sources for names.
Get two or three recent references and call them. Don’t trust photos the contractor brings as your only source of information.

2. Are you licensed in this state?
Certain cities require a contractor license. If the contractor doesn’t have one, the municipality can shut them down, leaving you mid-project with no contractor. If the contractor does not carry a license, then the liability rests on the homeowner. That means you are responsible for your own home, all those working on the home, and even the adjacent homes.

3. Are you insured for damages and workman injuries?
To ensure that you won’t be held liable for any injuries or damages that occur during your project, it is essential that your contractor has worker’s compensation, personal liability, and property damage coverage. Make sure their certificates are current.

4. Can you see samples of their work?
A competent contractor will have a portfolio of previous jobs, some of which may be similar to your project or other home plans. Ask to see those house designs — it can give you an understanding of their level of expertise in the type of changes you’d like to make to your home.

5. Have you operated under a different company name
Sometimes businesses grow and change their names. Other times they go bankrupt. If a company has operated under another name, be sure to find out why.

6. Have you ever declared bankruptcy?
This is an indicator of how well the contractor ran previous business. Use at your discretion.

7. Are there any past or pending judgments against you?
If a contractor is or was in a lawsuit, try to find out why and what the outcome was. Being involved in any lawsuit, however, could be a possible warning sign.

8. How much are your fees?
A trustworthy contractor will not ask for payment in full upfront, but he should create a payment schedule aligned with the production schedule. They should also be willing to negotiate the details. They will also have no problem handling change orders, or changes to the original plan, and will communicate with you continuously throughout your contract.

9. How long will this take?
An experienced contractor will have a system in place to create a timeline, specific to your job, that provides a sequence of construction and realistic, estimated completion date before work begins.

10. Can you see a sample contract to make sure costs and timing is clearly stated?
A written agreement greatly improves your odds of success when working with a general contractor. Never start work until you have a complete agreement signed by your general contractor. Make sure that the costs and time frame is clearly stipulated in the contract.

Asking these 10 questions when entering into a relationship with a general contractor will help you make a smart, informed decision. A little bit of effort upfront and lots of planning early on will reap countless benefits throughout this exciting time.

Q2 Multifamily Production Index (MPI) Gained 5 Points

0

By Ann Adamson

The National Association of Home Builders (NAHB) said for Q2 the Multifamily Production Index (MPI), a leading indicator for the multifamily market released byposted a gain of five points to a reading of 58. The good news is that this is the 10th quarter with a reading of 50 or above.

MPI measures builder and developer sentiment about the current apartment and condominium market conditions, which are rated on a scale of 0 to 100. This index is scaled so that any number over 50 showing that respondents are reporting that conditions are improving than reporting that the conditions are getting worse. MPI measures three important elements of the multifamily housing market:

1) The construction of market-rate rental units;

2) low-rent units, and;

3)”for-sale” units or condominiums.

In the second quarter of 2014, the MPI component tracking builder and developer perceptions of market-rate rental properties had a significant increase of nine points to 68, which is the highest reading since the third quarter of 2012; low-rent units increased four points to 52; and for-sale units rose two

The Multifamily Vacancy Index (MVI)

MVI measures the multifamily housing industry’s perception of vacancies. If the MVI has lower numbers, this indicates fewer vacancies. This increased one point to 38. MVI, the vacancy index, has been holding steady at a healthy level of 37 to 38 since late 2013. It is a bit above the low vacancy numbers we saw in 2011 and 2012, those low numbers were the result of depressed production with few new apartments coming on line.

Analysts agree that the strength of the MPI, the production index in Q2, is in part because we’ve seen employment improve, which allows younger consumers to form their own households.


  • Categories